
A decade ago, when the Republican Party was paying the price for the various cataclysms brought on by the George W. Bush presidency—the shockingly inadequate response to Hurricane Katrina, the ill effects of the Iraq War, the great economic meltdown—the Democratic Party reached its post–Great Society zenith. It nominated and elected the country’s first African-American president—and he won decisively, against an admired war hero. It sent sixty senators to Washington, which it hadn’t done in forty years (and back then, around a dozen of those were southern conservatives).1 It also sent 257 representatives to the House, its highest number since before the Gingrich Revolution of 1994. Its governors sat in twenty-eight executive mansions, including in such improbable states as Tennessee, Kansas, Oklahoma, and Wyoming.
Then came the rise of the Tea Party and the calamitous 2010 elections. The Republicans’ net gain of sixty-three seats in the House of Representatives, giving them control over that chamber after a four-year hiatus, swallowed most of the headlines (the party also had a net gain of six Senate seats). The Democrats, as President Obama put it, took a “shellacking.”
But perhaps the more consequential results happened in the states. Democrats lost a net total of four gubernatorial races, taking them down to a minority of twenty-two governorships. They lost gubernatorial contests in some important large states: Pennsylvania and Ohio; Michigan, where Governor Rick Snyder would make his fateful decision about the source of water for the city of Flint; and Wisconsin, where Scott Walker would pass anti-union legislation and steer state government hard to starboard. Florida, governed before that election by Charlie Crist, an independent who had left the GOP and criticized it as extremist, turned to the very conservative Republican Rick Scott. And all of those improbable states listed above eventually reverted to GOP control.
Democrats likewise took a pounding in state legislative races in 2010. Pennsylvania, Michigan, and Ohio had had divided legislatures before that election, and Wisconsin a Democratic one. All four went Republican. So did Maine, New Hampshire, North Carolina, Alabama, and Minnesota. Iowa, Louisiana, Colorado, and Oregon moved from Democratic control to having divided legislatures. In many of these states, the pendulum has never swung back, or it has swung more aggressively in the Republican direction, so that we now have, for example, thirty-three Republican governors and just sixteen Democratic ones, while Republicans maintain complete control of thirty-two state legislatures to the Democrats’ mere thirteen.
It was just one year, 2010, and one election. But it was a pivotal one, because it coincided with the decennial census and the drawing, in time for the 2012 elections, of new legislative districts at the federal and state levels. These newly empowered Republican governors and legislators found themselves with enormous power to reshape politics for a decade, and boy did they use it.
It cannot be said that what they did with their power stood flagrantly outside the tradition of American representative democracy, about which there is much to be ashamed—or at the very least, much of which fails to match the inspiring story we learned as schoolchildren. But it certainly can be said that these new Republican majorities—and a few Democratic ones, too, for example in Maryland—took partisan gerrymandering to new levels. And they did so immediately, so that in the 2012 elections, as the congressional voting analyst David Wasserman of the Cook Political Report found, Democratic candidates for the House of Representatives collectively won 1.37 million more votes than their Republican opponents, or 50.6 percent of the vote—but only 46 percent of the seats.2
As we head into this fall’s elections, the Democrats are expected to make big gains: most observers believe they’ll recapture the House, which they can do with a net gain of around twenty-four seats. That would effectively forestall President Trump’s enacting any sort of legislative agenda. Retaking the Senate—considered a tougher climb, but now thought possible by the experts in a way it was not a few months ago—would mean the Democrats could bottle up presidential nominations and even return the favor of what the Republicans did to Judge Merrick Garland in 2016 by blocking a nomination to the Supreme Court, should one open up.
But as the next census approaches, state executive mansions and legislatures are at least as important, as liberals have belatedly come to realize. The Democrats actually have two election cycles to see how much ground they can regain here, as new district lines won’t be drawn until after the 2020 election results are in. The party that wins the right to draw the legislative maps of the 2020s will have enormous power to shape future Congresses and state legislatures—to determine, for example, whether districts are drawn in such a way that Republicans need only worry about winning conservative votes and Democrats liberal ones, or in a way that might push candidates toward the center; and whether districts comply with the Voting Rights Act, in a decade when much demographic change is expected, enough to perhaps turn the crucial state of Texas at least purple, if not blue. Much is at stake.
Advertisement
The story of what the Republicans accomplished in 2010 is ably told by David Daley, the former editor of Salon, in his book Ratf**ked: The True Story Behind the Secret Plan to Steal America’s Democracy, which Elizabeth Drew reviewed favorably in these pages in 2016.3 In sum, the story starts in the summer of 2009, when Chris Jankowski, who worked for a group called the Republican State Leadership Committee, read a story in The New York Times emphasizing the importance of the 2010 elections. Like all Republican operatives, Jankowski was down in the dumps at the time. But reading that Times article gave him a sense of purpose and mission.
Jankowski grasped the connections immediately. Map-drawing is hugely important; state legislatures control map-drawing; many state legislatures are narrowly divided; many can therefore be “flipped” from one party to another with comparatively small amounts of money, far less than it would cost to flip a congressional seat. Jankowski quickly put together a plan named REDMAP (short for “Redistricting Majority Project”), which would help the Republican Party dominate politics for the decade to come. “Win big in 2010 and Republicans could redraw the maps and lock in electoral and financial advantages for the next ten years,” Daley writes. “Push just 20 [House] districts from competitive to safely Republican, and the GOP could save $100 million or more over the next decade.”
So Jankowski got his seed money and started setting up offices in the state capitals most important to the effort. Wind filled the project’s sails in the form of the crippled economy, which gave anti-Obama voters extra motivation to turn out that fall, and the January 2010 Citizens United Supreme Court decision, which opened the door for many millions of dollars of “dark money” (untraceable back to donors) to finance both individual campaigns and independent committees. REDMAP was off to the races.
Ratf**ked describes the striking results. In Wisconsin, Republicans went into the 2010 election with a 50–45 deficit in the state assembly and an 18–15 disadvantage in the Senate; they emerged with respective majorities of 60–38 and 19–14. In Michigan, Republicans already controlled the state senate. They maintained that control, and they flipped a twenty-three-seat deficit in the lower house to a sixteen-seat advantage. In North Carolina, a Democratic 30–20 advantage dissolved into a 31–19 Republican edge in the state senate; in the state house, the Republicans went from a 68–52 disadvantage to a 67–52 edge (with one independent). And so on, and on.
In every election, corners were cut, court precedents ignored, dirty deeds performed. In Pennsylvania, a thirteen-term Democratic state representative named David Levdansky was defeated because he allegedly voted for a “$600 million Arlen Specter Library.” Such allegations were made in ads paid for by the state Republican Party and the Republican State Leadership Committee. In fact, $600 million was the entire state budget, although even that was the initially appropriated figure; actual outlays, as Levdansky explains to Daley, typically come in lower. As for the amount of that total actually earmarked for the library in honor of the longtime senator, it was around $2 million. But by the time Levdansky got around to explaining all that, most voters had stopped listening.
That same fall in North Carolina, a Democrat named John Snow found himself the target of a mailing about a black felon named Henry Lee McCollum, who was serving time for the rape and murder of an eleven-year-old girl. “Thanks to arrogant State Senator John Snow,” it read, “McCollum could soon be let off of death row.” Snow lost. Four years later, McCollum, who has an IQ in the sixties, and his half brother were cleared of the crime on DNA evidence; Henry Lee had spent more than thirty years on death row.4
The tools of map-drawing began to grow more and more sophisticated in the 1980s, with the advent of computers. In one congressional district in Houston back then, two neighborhoods were united into the same district by inclusion of the Houston ship channel, where of course no actual voters lived. By now, districts can be drawn with such precision—including a specific census tract, excluding the one next door—that party registration of inhabitants can be calculated to the second or third decimal point. The result is districts that are so far removed from the “compact and contiguous” standard that courts have been known to apply that they become the butt of jokes. Pennsylvania’s current seventh congressional district, two blobs linked by a little strip of land that appears to be no more than a few miles wide, reminded one observer of nothing so much as “Donald Duck kicking Goofy.”
Advertisement
Through such techniques, the majority party can figure out ways to cram the voters of the minority party into as few districts as possible. Republicans in particular are assisted in this effort by the fact that Democrats and liberals tend to live in higher-density areas more often than Republicans and conservatives do. Hence, millions of Democrats are packed into comparatively fewer urban districts and suburban districts close to the city center, while Republicans are spread out over more districts. All this in turn means that Republicans can rack up impressive legislative majorities even as they are winning a minority of the vote.
This happened, as Daley documents, in state after state. In Wisconsin in 2012, for example, President Obama won 53 percent of the vote, and Democratic Senate candidate Tammy Baldwin won 51.4 percent. Democrats also won 50.4 percent of the aggregate vote for candidates for the House of Representatives, but Republicans took five of the state’s eight seats. In the state assembly, Democratic candidates overall received 174,000 more votes than GOP candidates, but Republicans won 60 percent of the seats.
A few rays of hope have recently emerged. Arizona is one of a handful of states (including California) that has turned over the drawing of legislative lines after the 2020 census to an independent commission. Such commissions will not be entirely free of politics, but they will surely be an improvement on legislators’ drawing districts for themselves and their friends.
Second, the courts have thrown out the egregious lines that Republicans drew in Pennsylvania, a state where Democrats outnumber Republicans, where until 2016 no Republican presidential candidate had won since 1988, where there had been twelve Democrats in the state’s House delegation to seven Republicans, but where after 2010 the congressional split went to 13–5 in the Republicans’ favor. The new map, which was drawn by the Pennsylvania Supreme Court and will be used this November, actually features districts that for the most part make some geographic sense and that most experts think will produce something more like an even split or a narrow Democratic advantage (which would reflect actual voter registration).5
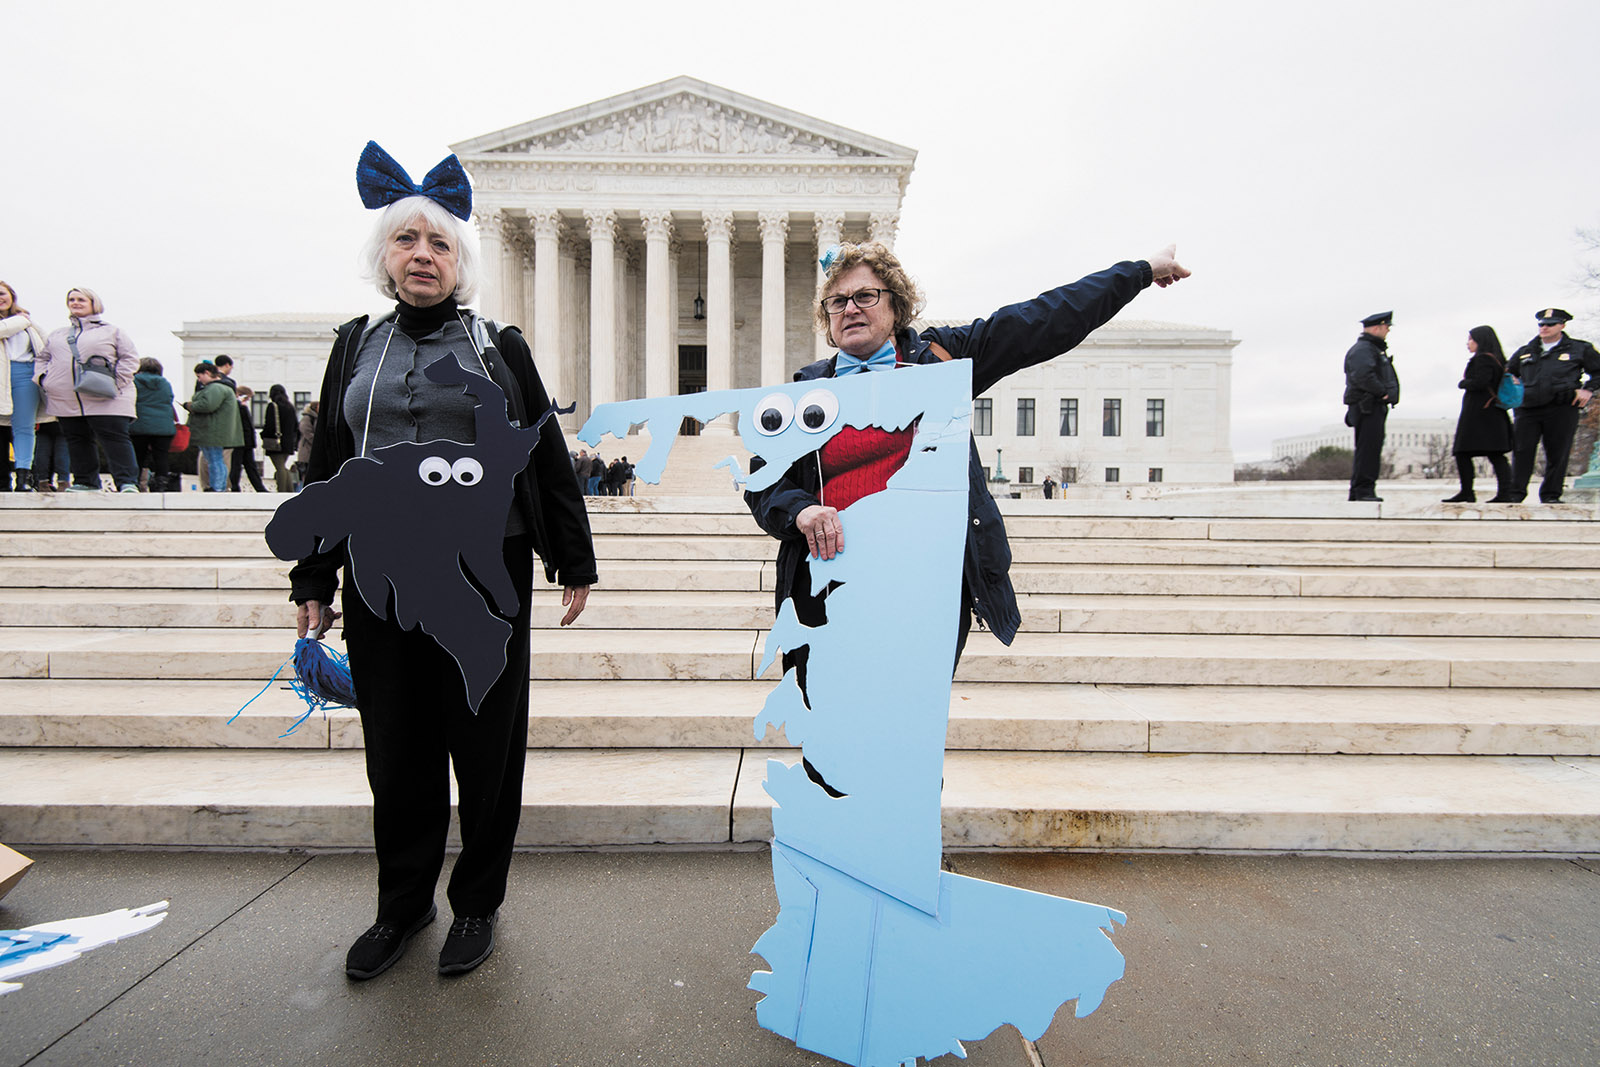
In June, the Supreme Court is expected to rule on two more gerrymandering cases—one coming from Wisconsin, where Republicans drew egregious lines, and another from Maryland, where Democrats were the culprits. At issue is whether a Court majority will define discernible standards for what constitutes partisan gerrymandering. If it does so, a flood of gerrymandering litigation is likely to ensue, which reformers hope will lend momentum to the movement to take the process out of politicians’ hands once and for all.
In the beginning, the edict was simple. The fifty-five delegates to the 1787 Constitutional Convention agreed—under the leadership of a committee led, ironically enough, by Elbridge Gerry, who some years later as governor of Massachusetts would lend his name to the practice under discussion here—that each member of the new House of Representatives would represent around 40,000 people. Later—on the last day of the convention—they lowered the number to 30,000. The Constitution they approved provided that every ten years, a census would be taken, and the size of House districts and number of representatives adjusted accordingly.
A census was duly conducted every decade, and the populations of congressional districts increased by a few thousand each time—37,000 in 1800, 40,000 in 1810, and so on. But the various states’ commitments to drawing fair districts was, shall we say, indifferent. This was a problem that went back to the British Parliament. As boroughs were incorporated, they demanded representation, and they were given it; but no one had yet thought (say, in the 1600s) about the problem of equal representation. As such, both towns with only a few people and fast-growing cities sent two representatives to Parliament. Nothing was done, and by 1783, writes Rosemarie Zagarri in The Politics of Size, a Commons committee reported that a majority of the body’s members was elected by just 11,075 voters—a staggering 1/170th of the population.6
The United Kingdom fixed this “rotten borough” problem with the Reform Act of 1832. In the United States, however, the boroughs just got rottener and rottener over the course of the nineteenth century and well into the twentieth. As immigrants began to arrive, and after the slaves were freed, and then as African-Americans left the southern fields for the northern cities, few states made any effort whatsoever to draw fair congressional districts every ten years. Most continued to conduct a census; they then resolutely ignored the results, openly thumbing their noses at the Constitution. The motivation, of course, was to deny cities—with their populations of immigrants and, later, black people—their rightful representation.
Here are some numbers, from J. Douglas Smith’s eye-opening 2014 book On Democracy’s Doorstep.7 The inequities nearly defy belief. In Illinois after World War II, the populations of congressional districts ranged from 112,000 to 914,000. The larger district was urban, the smaller one rural, and the larger number meant of course that urban areas had fewer representatives, and that residents of the larger district had about one eighth the voice in Congress that residents of the smaller district had. In midcentury California, the 6,038,771 residents of Los Angeles County had one state senator, the same as the 14,294 inhabitants of three rural Sierra counties. As you might guess, the numbers in the South were appalling, disenfranchising what black voters did exist. But of all the states, the worst was Michigan, where rural voters and the legislative barons of Lansing lived in mortal fear of Detroiters having their rightful political say in the state’s affairs.
So it went, for 170 long years. How did such states get away with this? The courts would not enforce fair districts. Aggrieved citizens filed lawsuits, and courts looked at the numbers and said “you’re right”; but they would go on to aver that this was a political matter best settled through politics. The story Smith tells is the harrowing process by which these wrongs were finally put right in the early 1960s in two landmark Supreme Court decisions, Baker v. Carr and Reynolds v. Sims. In Baker (1962), which originated in Tennessee, the Court held that apportionment was a “justiciable” issue, i.e., one on which court intervention was appropriate. Two years later in Reynolds, which originated in Alabama, the Court held by 8–1 that all legislatures (except the United States Senate) had to meet the “one person, one vote” standard of representation, so that districts all had more or less equal numbers of voters.
It’s a riveting tale, involving Archibald Cox, later of Watergate fame but in the early 1960s President Kennedy’s solicitor general, urging caution, and Robert F. Kennedy pushing for more aggressive arguments before the Court. Earl Warren was asked numerous times to name the toughest case decided while he presided as chief justice. The man who oversaw decisions like Brown v. Board of Education and Miranda v. Arizona always answered “apportionment.”
Two titans squared off as Justice William O. Douglas emerged as the biggest champion on the Court of taking on the apportionment issue, and Felix Frankfurter its chief opponent (during Baker deliberations; by the time of Reynolds, Frankfurter was gone). Another justice, Charles Evans Whittaker, was so tormented by the Baker deliberations that he had a nervous breakdown and left the Court. A movement started immediately to call a constitutional convention to undo this judicial treachery and return to the states the right to treat legislative representation as they pleased, egged on by Senate Republican leader Everett Dirksen. Thirty-three states said yes—leaving the effort one state short of success.
This is the larger historical background against which recent Republican efforts need to be understood. The history of legislative system-rigging by rural, conservative interests is a long and ignoble one. For most of our history, our democracy has been, in Smith’s memorable phrase, a “deliberately misshapen enterprise.”
Democrats have now, for the first time in modern history, set up the machinery to try to do in 2020 what the GOP accomplished in 2010. The National Democratic Redistricting Committee was established last year and is headed by Eric Holder, the former attorney general. “We have to come up with a system that is more neutral, because the reality now is that we have politicians picking their voters as opposed to citizens choosing who their representatives are going to be,” Holder said at a Harvard Kennedy School forum on April 30.
His group raised nearly $11 million in its first six months and has placed a dozen states on its “target” list and another seven on its “watch” list. In most states, the group covets the governor’s mansion, for obvious reasons, and hopes to flip at least one house of the state legislature. In Minnesota, Wisconsin, North Carolina, and Ohio, it’s also eyeing down-ballot races. It appears to be most focused on Ohio, where the offices of secretary of state (which oversees elections) and state auditor are on its list.
If successful, the Holder group’s efforts—he is also considering running for president, by the way—will bear late fruit. In the meantime, to capture the two dozen seats they need to control the House, Democratic candidates this fall will need to win considerably more than 51 percent of the total vote. Wasserman of the Cook Political Report estimates that Democrats need to beat Republicans by 7 percent overall, which is in the vicinity of the party’s lead in most polls asking respondents whether they prefer that Democrats or Republicans win this fall. But the Brennan Center for Justice issued a report in late March saying that the number needed to win is more like 11 percent. The report assumes different overall Democratic vote margins and from there projects potential Democratic seat gains in the House based on historical totals and on Brennan’s own estimates taking gerrymandering into account.8
Notice that even according to the more optimistic (at least in the lower range) historical expectation numbers, the Democrats would need to win the national vote margin by 6 percent to win enough seats to retake the House. Doing that is a tall order. Even in 2012, their best year in recent times, they won by only about 2 percent overall.
Every other sign for the Democrats has been encouraging. Enthusiasm has been far greater among Democratic voters than among Republican ones. Even when Democratic candidates have lost, they’ve lost encouragingly. In a late April special congressional election in Arizona, the Democratic candidate came within five points of the Republican in a district that both Donald Trump in 2016 and Mitt Romney in 2012 carried by more than twenty points. After the results came in, Wasserman tweeted: “If the only data point you had to go on was last night’s #AZ08 result, you’d think a 30–40 seat Dem House gain in Nov. would be way low.”
So Democrats have many reasons to retain their optimism. But if they fall short, the reason may have less to do with Donald Trump than with Chris Jankowski and his work in 2010 that stands far less athwart American political history and tradition than we’d prefer to believe.
—May 10, 2018

-
1
Technically, fifty-eight; but two independents, Bernie Sanders of Vermont and Angus King of Maine, caucused with the Democrats, giving them the crucial sixty votes needed to break a filibuster. ↩
-
2
The Cook paper itself is behind a paywall, but the numbers can be found at W. Gardner Selby, “Republicans Won More House Seats Than More Popular Democrats, Though Not Entirely Because of How Districts Were Drawn,” Politifact.org, November 26, 2013. ↩
-
3
“American Democracy Betrayed,” The New York Review, August 18, 2016. ↩
-
4
See Mandy Locke and Joseph Neff, “Pardoned Brothers’ Payout Triggers Fight Over Who Gets a Cut,” The Charlotte Observer, May 1, 2017. ↩
-
5
See Nate Cohn, Matthew Block, and Kevin Quealy, “The New Pennsylvania Congressional Map, District by District,” The New York Times, February 19, 2018. ↩
-
6
The Politics of Size: Representation in the United States, 1776–1850 (Cornell University Press, 1987), p. 37. ↩
-
7
On Democracy’s Doorstep: The Inside Story of How the Supreme Court Brought “One Person, One Vote” to the United States (Hill and Wang, 2014). ↩
-
8
Laura Royden, Michael Li, and Yurij Rudensky, “Extreme Gerrymandering and the 2018 Midterm,” Brennan Center for Justice, March 23, 2018. ↩